
KATHARINE HAYHOE, CLIMATE SCIENTIST
Posted by: chaamjamal on: Dece

THIS POST IS A CRITICAL REVIEW OF A TED CLIMATE SCIENCE LECTURE BY KATHARINE HAYHOE ON YOUTUBE. THE TITLE OF THE LECTURE IS “WHAT IF CLIMATE CHANGE IS REAL?”
LINK TO YOUTUBE VIDEO: https://youtu.be/
PART-1: A TRANSCRIPT OF THE LECTURE
We’re known for a lot of things here in West Texas. One of the things we’re very well known for is our fields of white cotton. and the friendly farmers. We don’t just grow cotton we also raise cows and we’re very well known for what we do with those cows (BARBECUE TRI TIP RIBS). And of course no talk at Texas Tech would be complete without mentioning something else we’re very well known for here in West Texas and that is our world class football. But there is something we are not so well known for here in West Texas. And it’s something we’ve seen a lot of lately. And I have to admit that when I was scraping the snow and ice off my car, I was tempted to think “Where’s global warming now? I’d like a little of that please! This is not what our winters should look like.

SO HERE WE ARE TALKING ABOUT WHAT IF THOUGH?
WHAT IF THIS GLOBAL WARMING THING IS … REAL?
WHAT IF, DESPITE OUR HANDS FREEZING OFF AND OUR TOES FEELING LIKE THEY HAVE TO BE AMPUTATED, WHAT IF THIS CLIMATE CHANGE THING IS REALLY REAL????

Well, if we look at what our temperatures look like recently, we see that yes, it was really cold where we are. BUT … if we look at other parts of the world we see that it was really warm. In fact, Alaska was just as much warmer than average as we have been colder than average. The lesson here is that it isn’t just what we see in front of our own eyes that can tell us whether global warming is real.
I want to tell you about a fun little experiment we did a couple of years ago If you take a group of people and divide them in half. Half of the people got put in a room that was quite warm (81F), uncomfortably warm. The other half of the people were put in a room at a comfortable room temperature (73F). And then the people were asked this question: IS CLIMATE CHANGE REAL? What do you think happened? Yes! it’s actually what you think. The group in the uncomfortably warm room said YES, climate change is real, global warming is real, I feel warm. The group in the cold room said NO! I actually feel that it isn’t. THAT’S HOW SENSITIVE WE ARE TO OUR ENVIRONMENT. Our physical experience informed us our brain sometimes in a conscious way and sometimes in an unconscious way. SO WHEN WE LOOK AT THIS ISSUE OF GLOBAL WARMING AND CLIMATE CHANGE WE HAVE TO LOOK GLOBALLY. We can’t just look in the place where we live. Not only that but we have to look over a sufficiently long period of time. Weather is what we all know and remember – what happens at a single place at a single time. Weather is like a tree and climate on the other hand is like a forest. Climate is long term average weather over 20 to 30 years. So (in the climate change issue) we’re not talking about weather, we are talking about WHETHER OUR CLIMATE IS CHANGING. That means we have to look over multiple decades.

So if we look here, this is the temperature of the earth starting in 1900 and we see that one year may be colder than the other and one might be warmer than the other but over the century as we correct for time our planet is getting warmer and warmer. That’s what we see in the data around the world. When we look further into time we see not only that but we are starting to break all kinds of records. Last year was, believe it or not, the warmest year on record. Even while it was slightly below average across the Eastern USA. If you just look at the Eastern USA where people are saying Oh it’s freezing in Atlanta, it’s freezing in Chicago, but the world is like “Oh it’s so hot, come visit us”.
But there are people saying that “This global warming has stopped”. Some of these people even show me some data looking at for example selected time spans such as 2001-2011, and it is true that if you pick and choose specific geographies and or time spans you can find the data that will support whatever hypothesis you’re looking to support (DATA SELECTION BIAS). But if you look at all the data without a data selection bias, you get an unbiased view that is very different. So be suspicious of people touting trends with a data selection bias to prove something. One thing we can know in science is that we can’t just throw out the data we don’t like just because we don’t like it. 5.49

If you go to the doctor and the doctor says you really need this procedure and you say, well, I don’t like it. So no, I will not do it. You are allowed to do that but it is not very wise. (He’s the doctor and you aren’t). And in fact, when you include 2014 in the data series you will see that it was the highest temperature on record. BUT you may say, OK, that’s just a thermometer and humans have been using these thermometers for a while. Is there any other evidence that it was the warmest? There is this. If you go up to the Arctic you will see permanently frozen ground melting and the homes of hundreds of Native American villages crumbling and falling into the ocean. We see that trees and flowers are blooming weeks earlier this year than they have over hundreds of years in the data record. We see that our heavy rainfall and even our heavy snowfall are getting worse as the humidity of the atmosphere increases. Warmer air means more water evaporates from our oceans, our lakes, and our rivers. And we see that our hurricanes are getting stronger because hurricanes are powered by warm ocean water and our oceans are warming.

If we look around the world we see 26,500 indicators of a warming planet. It is telling us that the planet is warming. So, is climate changing? Yes it is.

BUT … hasn’t the climate always changed before? Yes! It has changed before. It has changed because of different amounts of energy from the sun, and it has changed because of natural cycles. That is actually a large part of what we climate scientists do, We spend a lot of time studying the natural reasons of why climate changes on this planet. And when we study those natural reasons, this is what we see. Let’s look at the sun first. This is the temperature of the earth. Now let’s look at the energy from the sun but before we do I just want to ask you this question: If our earth temperature was going up, would that mean we are getting more energy from the sun or less energy from the sun?

The answer is “more” and in fact that’s how we know that we are getting more energy from the sun. Now let’s look at the sun’s energy and earth’s temperature together. The sun’s energy was going up until the 1970s but since then it’s been going down while the temperature went up. It can’t be the sun that’s controlling our current temperature because if it were we’d be getting cooler not warmer. So it can’t be the sun but maybe it’s a natural cycle. We know all the natural cycles here in West Texas, don’t we? We know about El Nino, we know about the droughts that La Nina brings and we’re certainly hoping that we’re going to get a nice wet year in the future. We have to recognize other things All that these cycles do is to move the heat around the earth. They don’t make the entire planet hotter or the entire planet colder They just move the heat from north or east to west and also between atmosphere and ocean.

So when we look at the whole planet there is only one type of natural cycle that causes the whole planet to get warmer and cooler. And that’s the natural cycle that creates glaciation cycles {“ice age”). So we know that we had a glaciation long time ago and we know that the glaciation ended when 10,000 yeas ago So the natural question is aren’t we still getting warmer from deglaciation? The answer is no because the warming trend of deglaciation peaked about 8,000 years ago. And if we look at the earth’s temperature for the last 6,000 years, this is what we see. Do you believe that? Our planet was actually getting cooler and our carbon dioxide level was stable until when?

Something happened about 300 years ago and we can see that in the earth’s record. Then and only then do we as climate scientists have intellectual permission say Ok then well “what happened at that time?”. Why is our climate changing? And when we do, it’s pretty easy to figure out where to point the finger.

We know that about 300 years ago we figured out how to take massive amounts of coal, oil, and natural gas out of the ground and burn them. It was a tremendous technological innovation. We would not be sitting here today if it were not for the industrial revolution (1760). I would not be alive today if it were not for the medical advances that came with the industrial revolution. The industrial revolution was an amazing thing for humankind. It brought untold benefits to our lives and our society… BUT… what we did not know at the time of the industrial revolution was that when we burn fossil fuels it produces a heat trapping gas called carbon dioxide (CO2).

Why do we care about carbon dioxide? We care about it because our planet has this amazing natural blanket. That natural blanket is totally transparent to energy from the sun. The energy from the sun comes in and hits the earth and the earth heats up. And then the earth heats up and gives off heat and those little invisible particles of carbon dioxide, methane, and water vapor trap that heat inside the earth system. Now this is entirely natural and a good thing because we’d be 60F colder today if it weren’t for this natural blanket. We’d be a frozen ball of ice if it weren’t for this blanket. So what’s the problem?

The problem is that we have been adding to that blanket. And so just like my grandma used to do on a cold night, she’d sneak into our room on cold night and put some extra blankets over us because she was afraid we’d freeze to death. We did have central heating. And so we’d wake up in the middle of the night saying “Grandma I did not need this blanket! That’s what we’re doing to our planet. We are sneaking up on our planet and we’re wrapping and extra blanket around our planet. And our planet is heating up.

SO, IS CLIMATE CHANGING? – YES IT IS!
DO WE KNOW WHY IT’S CHANGING? – YES, WE DO.
AND FOR THE FIRST TIME IN HUMAN CIVILIZATION, IT’S US. WE ARE MAKING THE CLIMATE CHANGE.
AND THAT LEADS US TO OUR FINAL QUESTION –
SO WHAT? WHAT DO WE DO?
THIS IS THE MOST IMPORTANT QUESTION BECAUSE THIS IS WHY WE CARE ABOUT CLIMATE CHANGE
IT’S BECAUSE OUR CIVILIZATION IS BUILT ON THE ASSUMPTION THAT WE CAN HAVE UPS AND DOWNS HEAT AND DROUGHT COLD AND WET BUT IT WILL ALL AVERAGE OUT IN THE END. WHAT HAPPENS IF IT DOESN’T AVERAGE OUT IN THE END?

A THOUSAND YEARS AGO WHAT WOULD HAPPEN IF SEA LEVELS WENT UP 3 FEET IN HOUSTON? OR IF THE CARIBOU MOVED TO NORTHERN ALASKA? NOT MUCH. BUT TODAY SUCH CHANGES WOULD HAVE A MAJOR IMPACT AND THAT IS WHY WE CARE ABOUT CLIMATE CHANGE. WE ARE ALREADY SEEING THE IMPACTS OF CLIMATE CHANGE HERE IN TEXAS. WE’RE SEEING INCREASED RISK OF WILDFIRES LIKE THE 2011 WILDFIRES. WE’RE SEEING INCREASED RISK OF DROUGHT AS HOTTER TEMPERATURES BAKE OUR SOIL. AND WE’RE EVEN SEEING INCREASED RISK OF FLOODS AS WARMER AIR MEANS MORE WATER AVAILABLE IN THE ATMOSPHERE THAT THE STORMS COULD PICK UP AND DUMP ON US. CLIMATE MAKES WEATHER MORE EXTREME.

SO WHAT IF CLIMATE CHANGE IS REAL, WHAT ARE WE SUPPOSED TO DO? TWO THINGS. THE FIRST THING WE NEED TO DO IS TO PREPARE FOR A CHANGING CLIMATE. FOR YEARS WE HAVE BEEN CONDUCTING OUR SOCIETY AS IF WE’RE DRIVING DOWN A DEAD STRAIGHT ROAD FROM LUBBOCK TO PLAINVIEW LOOKING IN OUR REAR VIEW MIRROR TO KEEP US ON THE ROAD. IT WORKS AS LONG AS THE ROAD WE ARE ON HAS NOT CHANGED SINCE WE WERE LAST ON IT UNLESS THERE IS A NEW CURVE IN THE ROAD UP AHEAD THAT WASN’T THERE BEFORE SO THAT IF YOU ARE STILL LOOKING IN YOUR REAR VIEW MIRROR YOU WILL HAVE A BAD ACCIDENT. THE ANALOGY IS THAT BUSINESS AS USUAL OF PLANNING FOR THE FUTURE WITH WHAT WE KNOW ABOUT THE PAST IS NO LONGER GOING TO WORK. WENOW HAVE TO RELY ON UNCERTAIN FORECASTS OF THE FUTURE AND PREPARE FOR DIFFERENT OUTCOMES THAT WHAT WE ARE USED TO. THE PAST IS A GOOD PREDICTER FOR THE FUTURE ONLY UNDER STEADY STATE CONDITIONS. THIS METHOD OF PLANNING FOR THE FUTURE IS NO LONGER VALID BECAUSE OF OUR CHANGING CLIMATE.

THIS IS WHY WE NEED CLIMATE SCIENTISTS TO LOOK DOWN THE ROAD FOR 20, 30, OR 40 YEARS TO TELL US THIS IS WHAT OUR WATER’S GOING TO LOOK LIKE, THIS IS WHAT OUR ENERGY DEMAND IS GOING TO LOOK LIKE, AND THESE ARE THE PLACE WHERE WE CAN GROW OUR FOOD AND OUR CROPS. BUT THERE IS ONE MORE THING WE NEED TO DO. WE ARE PUTTING THIS EXTRA BLANKET AROUND THE EARTH AND THAT BLANKET IS MADE UP OF HEAT TRAPPING GASES LIKE CARBON DIOXIDE. IF WE KEEP WRAPPING THICKER AND THICKER BLANKETS AROUND THE PLANET IT WILL HEAT UP FASTER AND FASTER AND OUR EXTREME WEATHER DESTRUCTIONS ARE GOING TO GET WORSE AND WORSE. AND THAT IS WHY IT IS ESSENTIAL TO TRANSITION FROM OUR OLD, DIRTY, AND INEFFICIENT SOURCES OF ENERGY TO NEW CLEAN SOURCES OF ENERGY THAT WILL NEVER RUN OUT ON US. EVERY TIME WE FLY INTO LUBBOCK WE SEE THESE ENORMOUS WINDFARMS THAT WE PASS OVER. LAST YEAR WE SET A RECORD HERE IN TEXAS WHEN IN THE MONTH OF MARCH WE GOT A THIRD OF OUR ELECTRICITY FROM WIND. SO THE ANSWER TO WHAT IF CLIMATE CHANGE IS REAL IS A CLEAN ENERGY ECONOMY. WE HAVE ENOUGH SOLAR POTENTIAL HERE IN TEXAS TO POWER THE ENTIRE WORLD TWO TIMES OVER. THIS IS WHY MY ANSWER TO THE QUESTION OF “WHAT IF CLIMATE CHANGE IS REAL” IS THAT IF CLIMATE CHANGE IS REAL TEXAS CAN LEAD THE WORLD TO A BETTER FURURE.


 THE VIEW OUR OF KATHARINE’S AIRLINE WINDOW
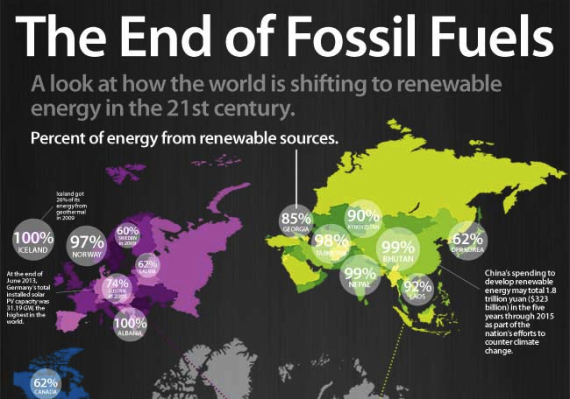
PART-2: CRITICAL COMMENTARY
ITEM#1: SO WHEN WE LOOK AT THIS ISSUE OF GLOBAL WARMING AND CLIMATE CHANGE WE HAVE TO LOOK GLOBALLY. We can’t just look in the place where we live. Not only that but we have to look over a sufficiently long period of time. Weather is what we all know and remember – what happens at a single place at a single time. Weather is like a tree and climate on the other hand is like a forest. Climate is long term average weather over 20 to 30 years. So (in the climate change issue) we’re not talking about weather, we are talking about WHETHER OUR CLIMATE IS CHANGING. That means we have to look over multiple decades.
COMMENT#1: This is a very relevant and important principle in climate science that is apparently not well understood in climate science. In the literature it is described as the “Internal Climate Variability” issue. It is described in a related post: LINK: https://tambonthongchai.
LINK#1: https://
LINK#2: https://
LINK#3: https://
LINK#4: https://
LINK#5: https://
ITEM#2: DATA SELECTION BIAS: The lecture rightly points out that climate denial arguments that commit the fallacy of data selection bias are not credible. As for example CLIMATE CHANGE DENIERS claiming that “GLOBAL WARMING HAS STOPPED” select specific geographical regions or time spans where the data appear to support their hypothesis. These claims do not show that climate change is not real or that climate change has stopped because of the flawed and biased methodology employed.
COMMENT#2: It is true that data selection bias in research invalidates the the conclusions drawn from that research but that principle applies equally to deniers and climate scientists. In the lecture we are told that “So when we look at the whole planet there is only one type of natural cycle that causes the whole planet to get warmer and cooler. And that’s the natural cycle that creates glaciation cycles“. This statement is false. There are significant temperature cycles in the Holocene interglacial and the one we are in is the most recent such temperature cycle. Therefore, that climate science has chosen to explain only one of them is a form of data selection bias. Therefore data selection bias is also found in the work of climate science that has itself stated in this lecture that data selection bias invalidates research findings. The most significant example of data selection bias in climate science is the selection of the warming since the end of the Little Ice Age (LIA) as a cause and effect phenomenon that can be explained in terms of human activity since the industrial revolution that appears to be timed just right for that change in the temperature trend. Significantly this warming cycle of the Holocene comes late in the progress of the interglacial for about 9,000 years. It was preceded by 8 other temperature cycles at centennial and millennial time scales, both warming and cooling described in a related post: LINK: https://
ITEM#3: CHANGES OF CONVENIENCE TO FIXED PARAMETERS: The lecturer shows a chart of atmospheric CO2 data saying that throughout history the CO2 level has been steady with some random up and down movements without a trend but that then something happened 300 years ago that coincides with a rising trend in atmospheric CO2 as seen in the chart above. We are told that the something that happened 300 years ago was the Industrial Revolution. The theory of AGW climate change as proposed is that it is a creation of the industrial economy such that it can be traced to the Industrial Revolution when the industrial economy got started.
COMMENT#3: The Industrial Revolution is thought to have started in England and spread to Europe and America over the period 1760 to 1840 with a median of 1800. The importance of the determination of this start year lies in the importance in climate science of “warming since pre-industrial“. This is because climate science has determined that the amount of warming since pre-industrial must not be allowed to exceed a benchmark value beyond which natural feedback processes will take over and make it impossible for humans to contain climate change with climate action consisting of not using fossil fuels. Therefore it is critical for us to know the reference pre-industrial year and to know the temperature in that reference pre-industrial year. In this lecture we are shown that the CO2 level began rising “300 years ago” which we can assume to be the year 2020-300=1720 but there was no industrial economy in 1720 so perhaps it’s a rounding error and that the real start of the curve was 260 years ago in 1760. This is consistent with the first IPCC report of 2001 where the pre-industrial reference year is set to 1760. However, in the 2015 IPCC report this pre-industrial year when CO2 began to rise and where we must find the reference temperature to measure warming since pre-industrial, was moved up to 1850, 170 years ago and not 300 years ago. This change is inconsistent with the claim in the lecture that what got this global warming started was something that happened 300 years ago. We also find that the identification of this critical pre-industrial year is different among climate scientists. For example NASA rocket scientists turned climate scientists and their premier climate scientist Dr. James Hansen have determined that this critical pre-industrial reference year when global warming began is 1950 and not 1850 found in the IPCC 2015 report. Yet another complication in this matter is an unsettled issue in climate science called the ETCW or Early Twentieth Century Warming discussed in a related post:
LINK: https://tambonthongchai.
This is a reference to the determination by climate science that the observed warming from 1850 to 1950 is anomalous and cannot be explained in terms of rising CO2. See for example Knutson 2000 where he writes, “The observed global warming of the past century occurred primarily in two distinct 20-year periods, from 1925 to 1944 and from 1978 to the present. Although the latter warming is often attributed to a human-induced increase of greenhouse gases, causes of the earlier warming are less clear because this period precedes the time of strongest increases in human-induced greenhouse gas (radiative) forcing. Results from a set of six integrations of a coupled ocean-atmosphere climate model suggest that the warming of the early 20th century could have resulted from a combination of human-induced radiative forcing and an unusually large realization of internal multidecadal variability of the coupled ocean-atmosphere system. This conclusion is dependent on the model’s climate sensitivity, internal variability, and the specification of the time-varying human-induced radiative forcing”. The use of 1950 as the reference pre-industrial year by NASA and others may be understood in this context. The conclusion we draw about the CO2 curve presented by the lecturer showing that the the long term CO2 curve with no trend “began to rise 300 years ago because something happened 300 years ago” is that this curve has no interpretation in terms of climate change science as understood by James Hansen, NASA, and the IPCC.

ITEM#4: The problem is that we have been adding to that blanket. And so just like my grandma used to do on a cold night, she’d sneak into our room on cold night and put some extra blankets over us because she was afraid we’d freeze to death. And so we’d wake up in the middle of the night saying “Grandma I did not need this blanket! That’s what we’re doing to our planet. We are sneaking up on our planet and we’re wrapping and extra blanket around our planet. And our planet is heating up.
COMMENT#4: This is the case against fossil fuels in climate change science. It holds that since the Industrial Revolution atmospheric CO2 concentration has been going up (ignoring the data here that the rise in atmospheric CO2 began prior to the Industrial Revolution as seen in item 3 above) and what is different about the industrial economy is that we are burning fossil fuels. Based on this concurrence climate science concluded that there must be a causation relationship between fossil fuel emissions and atmospheric CO2 concentration such that fossil fuel emissions of the industrial economy cause atmospheric CO2 to rise. This is the critical link between fossil fuels and global warming. Yet, as seen in the many humorous examples of spurious correlations by Tyler Vigen, concurrence does not prove causation.
Although it is true that correlation does not prove causation, at the minimum it must be shown that a statistically significant relationship exists at the time scale of the proposed causation. In climate science the assumed time scale is annual such that annual fossil fuel emissions cause annual changes in atmospheric CO2 concentration. The time scale can be imposed on the correlation test by first detrending the two time series and then computing the detrended correlation between them at the time scale of interest, in this case an annual time scale. This work has been carried out in two related posts on this site where we find no detrended correlation at an annual time scale:
LINK#1: https://
LINK#2: https://
A more comprehensive study of the relationship between emissions and changes in atmospheric CO2 concentration is presented in yet another related post on this site:
LINK: https://tambonthongchai.
The results of the analysis presented in these related posts show that there is no evidence that atmospheric CO2 concentration is responsive to fossil fuel emissions at an annual time scale. The observation by climate science that atmospheric CO2 has been rising at a time of fossil fuel emissions is a case of concurrence that does not serve as evidence for causation. No evidence for this critical causation in climate science is found in climate science or in this lecture.

ITEM#5: CLEAN ENERGY: At the end of a lecture on how fossil fuel emissions cause warming with the implication that warming can be hazardous and that the rate of warming can and must be attenuated by giving up fossil fuel energy and moving the world energy infrastructure to renewables, the lecturer notes with great pleasure that the world and the lecturer’s home state of Texas are moving away from fossil fuels to CLEAN ENERGY.
COMMENT#5: CLEAN ENERGY: That the relevant issue here is cleanliness and not climate change suggests that the underlying activism in climate activism is anti fossil fuel activism and not climate science. This aspect of climate science is explored in a related post: LINK: https://


FOOTNOTE: THE SOLAR CYCLE
In a sunspot cycle presentation, Professor Hayhoe displays the chart shown above where a span of 40 years is presented to demonstrate the absence in the responsiveness of temperature to the sunspot cycle. We show in a related post both in terms of data and in terms of bibliography, that 40 years is not a sufficient time span for this analysis. LINK: https://
BIBLIOGRAPHY: PRECAUTIONARY PRINCIPLE IN THE ENVIRONMENTAL SCIENCES
- Foster, Kenneth R., Paolo Vecchia, and Michael H. Repacholi. “Science and the precautionary principle.” Science 288.5468 (2000): 979-981. The Precautionary Principle has become enshrined in international law, and is the basis for European environmental legislation. However, “precautionary” decisions have been controversial, and the principle itself lacks clear definition. A recent commentary by the European Commission offers guidelines for politically transparent application of the principle, while emphasizing the need for careful review of relevant scientific data. Recent precautionary policies for limiting public exposure to radio-frequency energy shows that the principle can be applied in a way that does not conflict with traditional exposure guidelines. Major uncertainties still remain in the standard of proof needed to invoke the principle.
- Kriebel, David, et al. “The precautionary principle in environmental science.” Environmental health perspectives 109.9 (2001): 871-876. Environmental scientists play a key role in society’s responses to environmental problems, and many of the studies they perform are intended ultimately to affect policy. The precautionary principle, proposed as a new guideline in environmental decision making, has four central components: taking preventive action in the face of uncertainty; shifting the burden of proof to the proponents of an activity; exploring a wide range of alternatives to possibly harmful actions; and increasing public participation in decision making. In this paper we examine the implications of the precautionary principle for environmental scientists, whose work often involves studying highly complex, poorly understood systems, while at the same time facing conflicting pressures from those who seek to balance economic growth and environmental protection. In this complicated and contested terrain, it is useful to examine the methodologies of science and to consider ways that, without compromising integrity and objectivity, research can be more or less helpful to those who would act with precaution. We argue that a shift to more precautionary policies creates opportunities and challenges for scientists to think differently about the ways they conduct studies and communicate results. There is a complicated feedback relation between the discoveries of science and the setting of policy. While maintaining their objectivity and focus on understanding the world, environmental scientists should be aware of the policy uses of their work and of their social responsibility to do science that protects human health and the environment. The precautionary principle highlights this tight, challenging linkage between science and policy.
- Smith, Roy L. “Risk-based concentrations: prioritizing environmental problems using limited data.” Toxicology 106.1-3 (1996): 243-266. A difficult task faced by regulatory agencies is that of choosing, on the basis of limited data, which environmental problems to address. This paper incorporates USEPA risk assessment methods into a quantitative approach for prioritizing locations, contaminants and media according to potential health risk. USEPA has developed either a reference dose (a chronic dose without adverse effect) or slope factor (upper bound lifetime cancer risk per mg · kg−1 · d−1) for many substances. This work combines these ‘toxicological constants’ with predetermined risk levels (either a 10−6 cancer risk or a chronic intake equal to the reference dose) and protective human exposure assumptions (e.g. 70-kg body mass, 30-year exposure, 2-l · d−1 drinking water ingestion, etc.) to produce risk-based concentrations for 596 contaminants in air, drinking water, edible fish and soil. Because USEPA designed its methods to estimate upper bound risks, these risk-based concentrations are likely to be protective of human health. Regulatory officials can use this information to calculate numerical ratios between measured environmental levels and risk-based concentrations. These ratios serve as a surrogate for potential health impacts and can be used to prioritize problems for attention. Ratio calculation and ranking can be automated for searches of computerized environmental databases.
- Goldstein, Bernard D. “The precautionary principle also applies to public health actions.” American Journal of Public Health 91.9 (2001): 1358-1361. The precautionary principle asserts that the burden of proof for potentially harmful actions by industry or government rests on the assurance of safety and that when there are threats of serious damage, scientific uncertainty must be resolved in favor of prevention. Yet we in public health are sometimes guilty of not adhering to this principle. Examples of actions with unintended negative consequences include the addition of methyl tert-butyl ether to gasoline in the United States to decrease air pollution, the drilling of tube wells in Bangladesh to avoid surface water microbial contamination, and villagewide parenteral antischistosomiasis therapy in Egypt. Each of these actions had unintended negative consequences. Lessons include the importance of multidisciplinary approaches to public health and the value of risk–benefit analysis, of public health surveillance, and of a functioning tort system—all of which contribute to effective precautionary approaches. PUBLIC HEALTH ADVOCATES around the world have increasingly invoked the precautionary principle as a basis for preventive actions.1–9 This has been particularly true for environmental and food safety issues, in which the precautionary principle has moved from being a rallying cry for environmental advocates to a legal principle embodied in international treaties.2,6,8–11 Definitional issues have become more important as the term has made the transition from a noble goal to a component of legal requirements. For the purposes of this commentary, a useful definition is one that is contained in the 1989 Rio Declaration12: “Nations shall use the precautionary approach to protect the environment. Where there are threats of serious or irreversible damage, scientific uncertainty shall not be used to postpone cost-effective measures to prevent environmental degradation.” The upsurge in use of the term “precautionary principle” has been relatively sudden. For example, changes in the approach to hazardous air pollutants in the 1990 US Clean Air Act Amendments embody the precautionary principle. Until then, control of individual air pollutants in this category depended on a risk-based approach in which the burden of proof was on the US Environmental Protection Agency (EPA) to demonstrate that environmental levels of the air pollutant were likely to produce adverse effects. Further, the extent of imposed control measures was based on the feasibility of reducing risk. Instead, the 1990 amendments state that maximal available control technology is to be used on each of more than 180 pollutants unless the pollutant can be clearly shown to be harmless. Shifting the burden of proof and moving away from risk science to a technology-based approach were much debated at the time, but the term “precautionary principle” was not part of the debate. Now it certainly would be, although whether this precautionary approach will be more successful than the previous risk-based approach is still open to debate. For example, germane to the broader issue of the value of the precautionary principle is the question of whether regulating specific air pollutant emission control technology will stifle the invention and application of newer, more effective technology. At its core, the precautionary principle contains many of the attributes of good public health practice, including a focus on primary prevention and a recognition that unforeseen and unwanted consequences of human activities are not unusual. Yet there are at least 3 recently reported examples of actions taken in the name of improving public health that would better have been avoided or at least considered more carefully beforehand. I argue that the precautionary principle needs to be applied to public health actions as well as to actions pursued by government and industry for competitive and economic reasons. It is not my intention to provide a well-rounded critique of the precautionary principle, which is discussed by Kriebel and Tickner13 and by Jamieson and Wartenburg14 in this issue of the Journal.
BIBLIOGRAPHY: DATA SELECTION BIAS
- Ambroise, Christophe, and Geoffrey J. McLachlan. “Selection bias in gene extraction on the basis of microarray gene-expression data.” Proceedings of the national academy of sciences 99.10 (2002): 6562-6566. In the context of cancer diagnosis and treatment, we consider the problem of constructing an accurate prediction rule on the basis of a relatively small number of tumor tissue samples of known type containing the expression data on very many (possibly thousands) genes. Recently, results have been presented in the literature suggesting that it is possible to construct a prediction rule from only a few genes such that it has a negligible prediction error rate. However, in these results the test error or the leave-one-out cross-validated error is calculated without allowance for the selection bias. There is no allowance because the rule is either tested on tissue samples that were used in the first instance to select the genes being used in the rule or because the cross-validation of the rule is not external to the selection process; that is, gene selection is not performed in training the rule at each stage of the cross-validation process. We describe how in practice the selection bias can be assessed and corrected for by either performing a cross-validation or applying the bootstrap external to the selection process. We recommend using 10-fold rather than leave-one-out cross-validation, and concerning the bootstrap, we suggest using the so-called .632+ bootstrap error estimate designed to handle overfitted prediction rules. Using two published data sets, we demonstrate that when correction is made for the selection bias, the cross-validated error is no longer zero for a subset of only a few genes.
- Reid, J. Leighton, Matthew E. Fagan, and Rakan A. Zahawi. “Positive site selection bias in meta-analyses comparing natural regeneration to active forest restoration.” Science advances 4.5 (2018): eaas9143. Several recent meta-analyses have aimed to determine whether natural regeneration is more effective at recovering tropical forests than active restoration (for example, tree planting). We reviewed this literature and found that comparisons between strategies are biased by positive site selection. Studies of natural forest regeneration are generally conducted at sites where a secondary forest was already present, whereas tree planting studies are done in a broad range of site conditions, including non-forested sites that may not have regenerated in the absence of planting. Thus, a level of success in forest regeneration is guaranteed for many studies representing natural regeneration, but not for those representing active restoration. The complexity of optimizing forest restoration is best addressed by paired experimentation at the same site, replicated across landscapes. Studies that have taken this approach reach different conclusions than those arising from meta-analyses; the results of paired experimental comparisons emphasize that natural regeneration is a highly variable process and that active restoration and natural regeneration are complementary strategies.
- Bevan, Shaun, et al. “Understanding selection bias, time-lags and measurement bias in secondary data sources: Putting the Encyclopedia of Associations database in broader context.” Social science research 42.6 (2013): 1750-1764. Secondary data gathered for purposes other than research play an important role in the social sciences. A recent data release has made an important source of publicly available data on associational interests, the Encyclopedia of Associations (EA), readily accessible to scholars (www.policyagendas.org). In this paper we introduce these new data and systematically investigate issues of lag between events and subsequent reporting in the EA, as these have important but under-appreciated effects on time-series statistical models. We further analyze the accuracy and coverage of the database in numerous ways. Our study serves as a guide to potential users of this database, but we also reflect upon a number of issues that should concern all researchers who use secondary data such as newspaper records, IRS reports and FBI Uniform Crime Reports.
- Whitehead, John C. “Environmental interest group behavior and self‐selection bias in contingent valuation mail surveys.” Growth and Change 22.1 (1991): 10-20. This paper analyzes the behavior of a general sample and an environmental interest group sample in a contingent market for wetlands preservation. Mail survey response rates and environmental values for wetlands preservation are significantly greater in the environmental interest group sample than in the general population sample. An estimate of the potential self‐selection bias in the benefits of wetlands preservation is made. These results suggest that self‐selection bias in contingent valuation mail surveys could upwardly bias aggregate benefit estimates as much as 50 percent. Potential, but costly, solutions to the problem of self‐selection bias are suggested.
No comments:
Post a Comment